Study title: Economic Climate Survey
The purpose of the survey is to provide information on assessments of the current and anticipated economic climate expressed by the directors of the surveyed units.
| Rok |
|---|
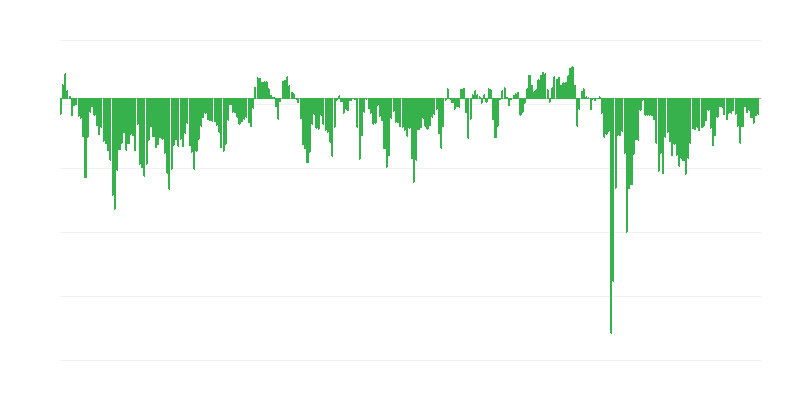
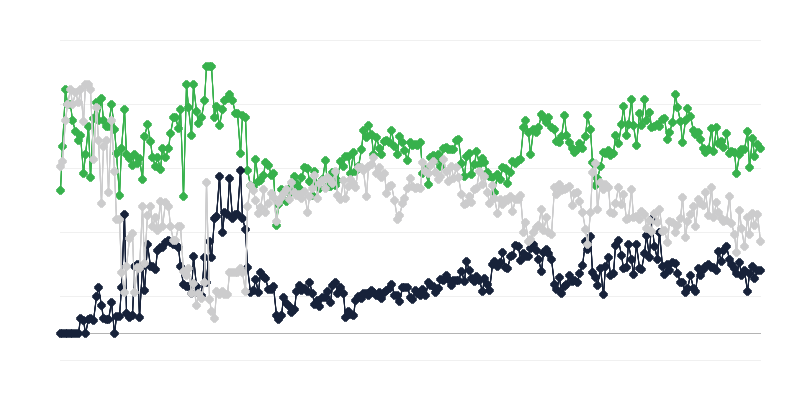
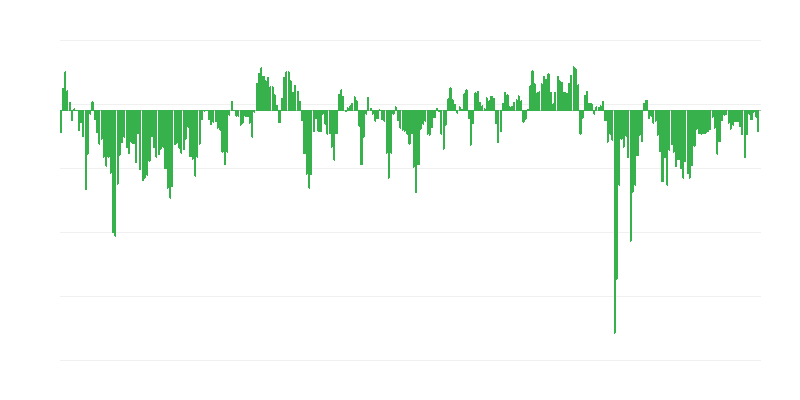
In April 2025, capacity utilization amounted to 77.6% (+1.5 p.p. m/m).
Study title: Economic Climate Survey
The purpose of the survey is to provide information on assessments of the current and anticipated economic climate expressed by the directors of the surveyed units.
The overall economic indicators characterizing the state of a country's or market's economy, allowing for the evaluation of developmental trends; the climate is subject to indicators mainly dependent on the business cycle, as well as other factors: regular (e.g., seasonal fluctuations in demand and supply) and irregular (e.g., agricultural yield or failure, increase or decrease in demand for a given product on the domestic or foreign market, natural disasters).
The data is processed by Content Writer — a limited liability company based in Poland — as part of the independent WorldIndex project. The initiative’s goal is to provide free access to current public data for analyzing trends and better understanding the world.
We also offer commercial access to the WorldIndex API, which provides direct access to data via an API. This allows companies, organizations, and individual users to integrate a real-time information stream into their applications, analytical systems, or AI models.
Data provider: GUS – Department of Macroeconomic Studies and Finance.
The presented information comes from the Domain Knowledge Bases (DBW), maintained by the Polish Central Statistical Office (GUS) and made available under the CC BY 4.0 license.
The chart retrieves data in real time from the DBW API to ensure the most up-to-date and reliable information possible.
If you have detailed questions about the study, we encourage you to contact the data provider directly.
Use reliable and regularly updated data sources in your reports.
<iframe src="https://contentwriter.com.bd/worldindex/poland/economy/economic-climate-pl/capacity-utilization/?template=embed-chart" width="100%" height="750" frameborder="0" style="border: none;"></iframe>
The chart was manually prepared and approved by our data analysts.
The chart is connected to the data source, ensuring instant updates.
You can use the above data in your applications via the Polish API data.
Follow WorldIndex for Free